
Thingiverse remix graph: visualizing the net of physical things
I recently became a happy owner of a Solidoodle 2 3D printer. This has been the start of a beautiful addiction, but more on the hardware hacking aspects in another post.
If you haven’t heard of it before, 3D printing refers to a family of manufacturing methods, originally developed for rapid prototyping, the first of which appeared almost three decades ago. Much like mainframe computers in the 1960s, professional 3D printers cost up to hundred thousands of dollars. Starting with the RepRap project a few years ago, home 3D printers are now becoming available, in the few hundred to a couple of thousand dollar price range.  For now, these are targeted mostly to tinkerers, much closer to an Altair or, at best, an Apple II, than a MacBook. Despite the hype that currently surrounds 3D printing, empowering average users to turn bits into atoms (and vice versa) will likely have profound effects, similar to those witnessed when content (music, news, books, etc) went digital, as Chris Anderson eloquently argues with his usual, captivating dramatic flair. Personally, I’m similarly excited about this as I was about “big data” (for lack of a better term) around 2006 and mobile around 2008, so I’ll take this as a good sign. :)
One of the key challenges, however, is finding things to print!  This is crucial for 3D printing to really take off. Learning CAD software and successfully designing 3D objects takes substantial, time, effort, and skill. Affordable 3D scanners (like the ones from Matterform, CADscan, and Makerbot) are beginning to appear. However, the most common way to find things is via online sharing of designs. Thingiverse is the most popular online community for “thing” sharing. Thingiverse items are freely available (usually under Creative Commons licenses), but there is also commercial potential: companies like Shapeways offer both manufacturing (using industrial 3D printers and manual post-processing) and marketing services for “thing” designs.
I’ve become a huge fan of Thingiverse.  You can check out my own user profile to find things that I’ve designed myself, or things that I’ve virtually “collected” because I thought they were really cool or useful (or both). Thingiverse is run by MakerBot, which manufactures and sells 3D printers, and needs to help people find things to print. It’s a social networking site centered around “thing” designs. Consequently, the main entities are people (users) and things, and links/relationships revolve around people creating things, people liking things, people downloading and making things, people virtually collecting things, and so on. Other than people-thing relationships, links can also represent people following other people (a-la Twitter or Facebook), and things remixing other things (more on this soon). Each thing also has a number of associated files (polygon meshes for 3D printing, vector paths for lasercutting, original CAD files—anything that’s needed to make the thing).
The data is quite rich and interesting. I chose to start with the remix relationships. When a user uploads a new design, the can optionally enter one or more things that their design “remixes”. In a sense, a remix is similar to a citation, and it conflates a few, related meanings. It can indicate an original source of inspiration; e.g., I see a design for 3D printable chainmail and decide that I could use a similar link shape and pattern to make a chain link bracelet.  I could design the bracelent from scratch, using just the chainmail idea, or perhaps I could download the original chainmail CAD files (if their creator made them available) and re-use part of the code/design.  A remix could also indicate partial relatedness: I download and make a 3D printer (yes, it’s possible, if you have the time—or, in this case, you can buy it instead) and decide to design a small improvement to a part.  Finally, a remix may indicate use of a component library (e.g., for embossed text, gears, electronic components, and much more).
Remix links can also be created automatically by apps. Like any good social networking platform, Thingiverse also has an API for 3rd party apps. The most popular Thingiverse app is the Customizer: anyone who can write parametric CAD designs may upload them and allow other users to create custom instances of the general design by choosing specific parameter values (which can be dimensions, angles, text or photos to emboss, etc).  For example, the customizable iPhone case allows you to chose your iPhone model, the case thickness, and the geometric patterns on the back.  Another popular parametric design is the wall plate customizer, which allows you to choose the configuration of various cutouts (for power outlets, switches, Ethernet jacks, etc) and print a custom-fit wallplate. A parametric design is essentially a simple computer program that describes a solid shape (via constructive solid geometry and extrusion operators). The Customizer will execute this program and render the solid on a server, generating a new thing, which will automatically have a remix link to the original parametric design.
So let’s get back to the remix relationship.  While I was waiting for my 3D printer to arrive, I spent some time browsing Thingiverse.  I noticed that I was frequently following remix hyperlinks to find related things, but following a trail was getting tedious and I was losing track.  So, I decided to make something that gives a birds eye view of those relationships. What are people creating, and how are they reusing both ideas and their digital representations? Last week I hacked together a visualization (using the absolutely amazing D3 libraries) to begin answering this question. Here is the largest connected component of the remix graph, which consists of about 3,500 things (nodes). If you think about it, its pretty amazing: more than 5% of the things (or at least those in my data) are somehow related to one another.  It may not seem like much at first, but check out the variety of things and you’ll see some pretty unexpected relationships (direct or indirect).
")
Clicking on the hyperlink or the image above will take you to an interactive visualization (if you’re on an iPad, you may want to grab your laptop for this component; D3 is pretty darn fast, but 3,500 nodes on an iPad is pushing it a bit :).  You can click-drag (on a blank area) to pan, and turn your scroll wheel (or two-finger scroll on a touchpad, or pinch on an iPad) to zoom. Nodes in red are things that a site editor/curator chose to feature on Thingiverse. Each featured thing is prominently displayed on the site’s frontpage for about a day. Graph links (edges) are directed and represent remix relationships (from a source thing to a derived thing).  If you mouse over a node, you’ll see some basic information in a tooltip, and outgoing links (i.e., links to things inspired or derived from that node) will be highlighted in green, whereas incoming links will be highlighted in orange. You can open the corresponding Thingiverse page to check out a thing by clicking on a graph node.  Finally, on the right-hand panel you can tweak a few more visualization parameters, or choose another connected component of the remix graph.
Before moving on to other components, a few remarks on the graph above: Although cycles are conceivable (I see thing X and it inspires me to remix it into thing Y, then the creator of X sees the remix action in his newsfeed, checks out my thing, and incorporates some of my ideas back into X, adding a remix link annotation in the process), it seems that this is never the case: the remix graph (or at least the fraction in this visualization, which is substantial) is, in practice, a DAG (directed, acyclic graph). Next, many of the large star subgraphs are centered around customizable (parametric) things; for example the large star on the left is the iPhone case (noted above) and it’s variations. Most of the remixes are simple instances of the parametric design, but some sport more involved modifications (e.g., cases branded with company logos). However not all stars fall in this category. For example, the star graph with many red nodes near the bottom left is centered around a 3D scan of Stephen Colbert, made on the set of the show. This has inspired may remixes, into things like ColberT-Rex, or Cowbert. Most of these remixes have one parent node, but some combine more than one 3D model; for example a cross between Colbert and the Stanford bunny is the Colberabbit, and a cross between Colbert and an octopus is Colberthulu. The original Colbert scan and most of it’s remixes were featured on Thingiverse’s frontpage (apparently the site editors are huge Colbert fans?).
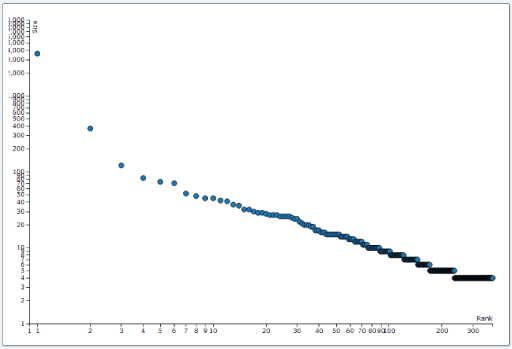
So, anyway, how about the other connected components? The distribution of component sizes follows a power law (again, click on the image for an interactive plot—singleton components are not included), no surprises here:
Components beyond the giant one are also interesting (as always, click on each image for the interactive visualization).  For example, the component on the left below consists of things inspired by a 3D-printable chainmail design, which also includes things like link bracelets, etc.  The component on the right contains various designs for… catapults!
")
")
Some components contain pretty useful stuff, such as the one with items for kid’s parties (e.g., coasters, cookie cutters) — on the left.  Since many people in the community are tinkerers, there are many 3D-printable parts for.. 3D-printers!  An example is the component on the right, which is centered around the design files for the original MakerBot Replicator, and around it are related items (like covers and other modifications).
") Â
 ")
Other components contain cool, geeky things, such as the small but well-featured component on the left, with figures and items from the Star Wars universe (including Darth Vader, as well as Yoda, remixed into a “gangsta” and other things). Â Finally, not all components consist of 3D-printable things. Â The component on the right has designs for lasercutting plywood so it can be folded, which was remixed into book covers, Kindle covers, and other things:
")
")
All this is just a fraction of what’s out there. Thingiverse is also growing at an amazing pace: around March when I collected some of this data there were about 60,000 things and now there are over 100,000 things (the latter number is based simply on what appears to be linearly assigned thing IDs). Â That’s roughly a doubling in four months; the exponential trend is going on strong! Â This is quite impressive given the small (but fast-growing) size of the home 3D printer market.
Visualizing just the remix aspect of the Thingiverse is a start. For example, another thing I found myself doing when browsing Thingiverse is following indirect same-collection links (rather than direct remix links) to find related items. Once I get over gaping at the graph and all the stuff on Thingiverse (some of which I’ve printed on my Solidoodle), there are a few things to try in terms of data/graph properties as well as in terms of improving the visualization as a tool to browse the Thingiverse and discover interesting and useful things more effectively. If anyone is actually reading this :) and there is something you’d like to see, please chip in a comment.
Postscript: My favorite cluster among those I spotted in the visualization is probably the one related to Colbert (see above), with the Colberabbit (“a godless killing machine”) a particular favorite. Â I’ll be printing one of those soon. :)